2.2 Editing and viewing DICOM data
2.2.V1.9-01
Use presets, Hounsfield unit (HU) controls, and color settings to adjust the visualization of DICOM data.
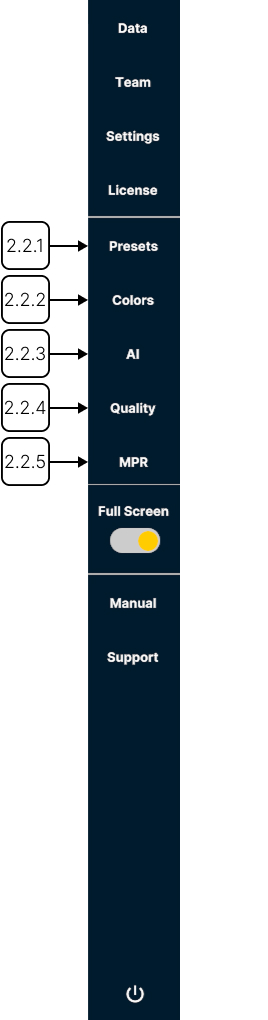
2.2.1
Presets
2.2.1.V1.9-01
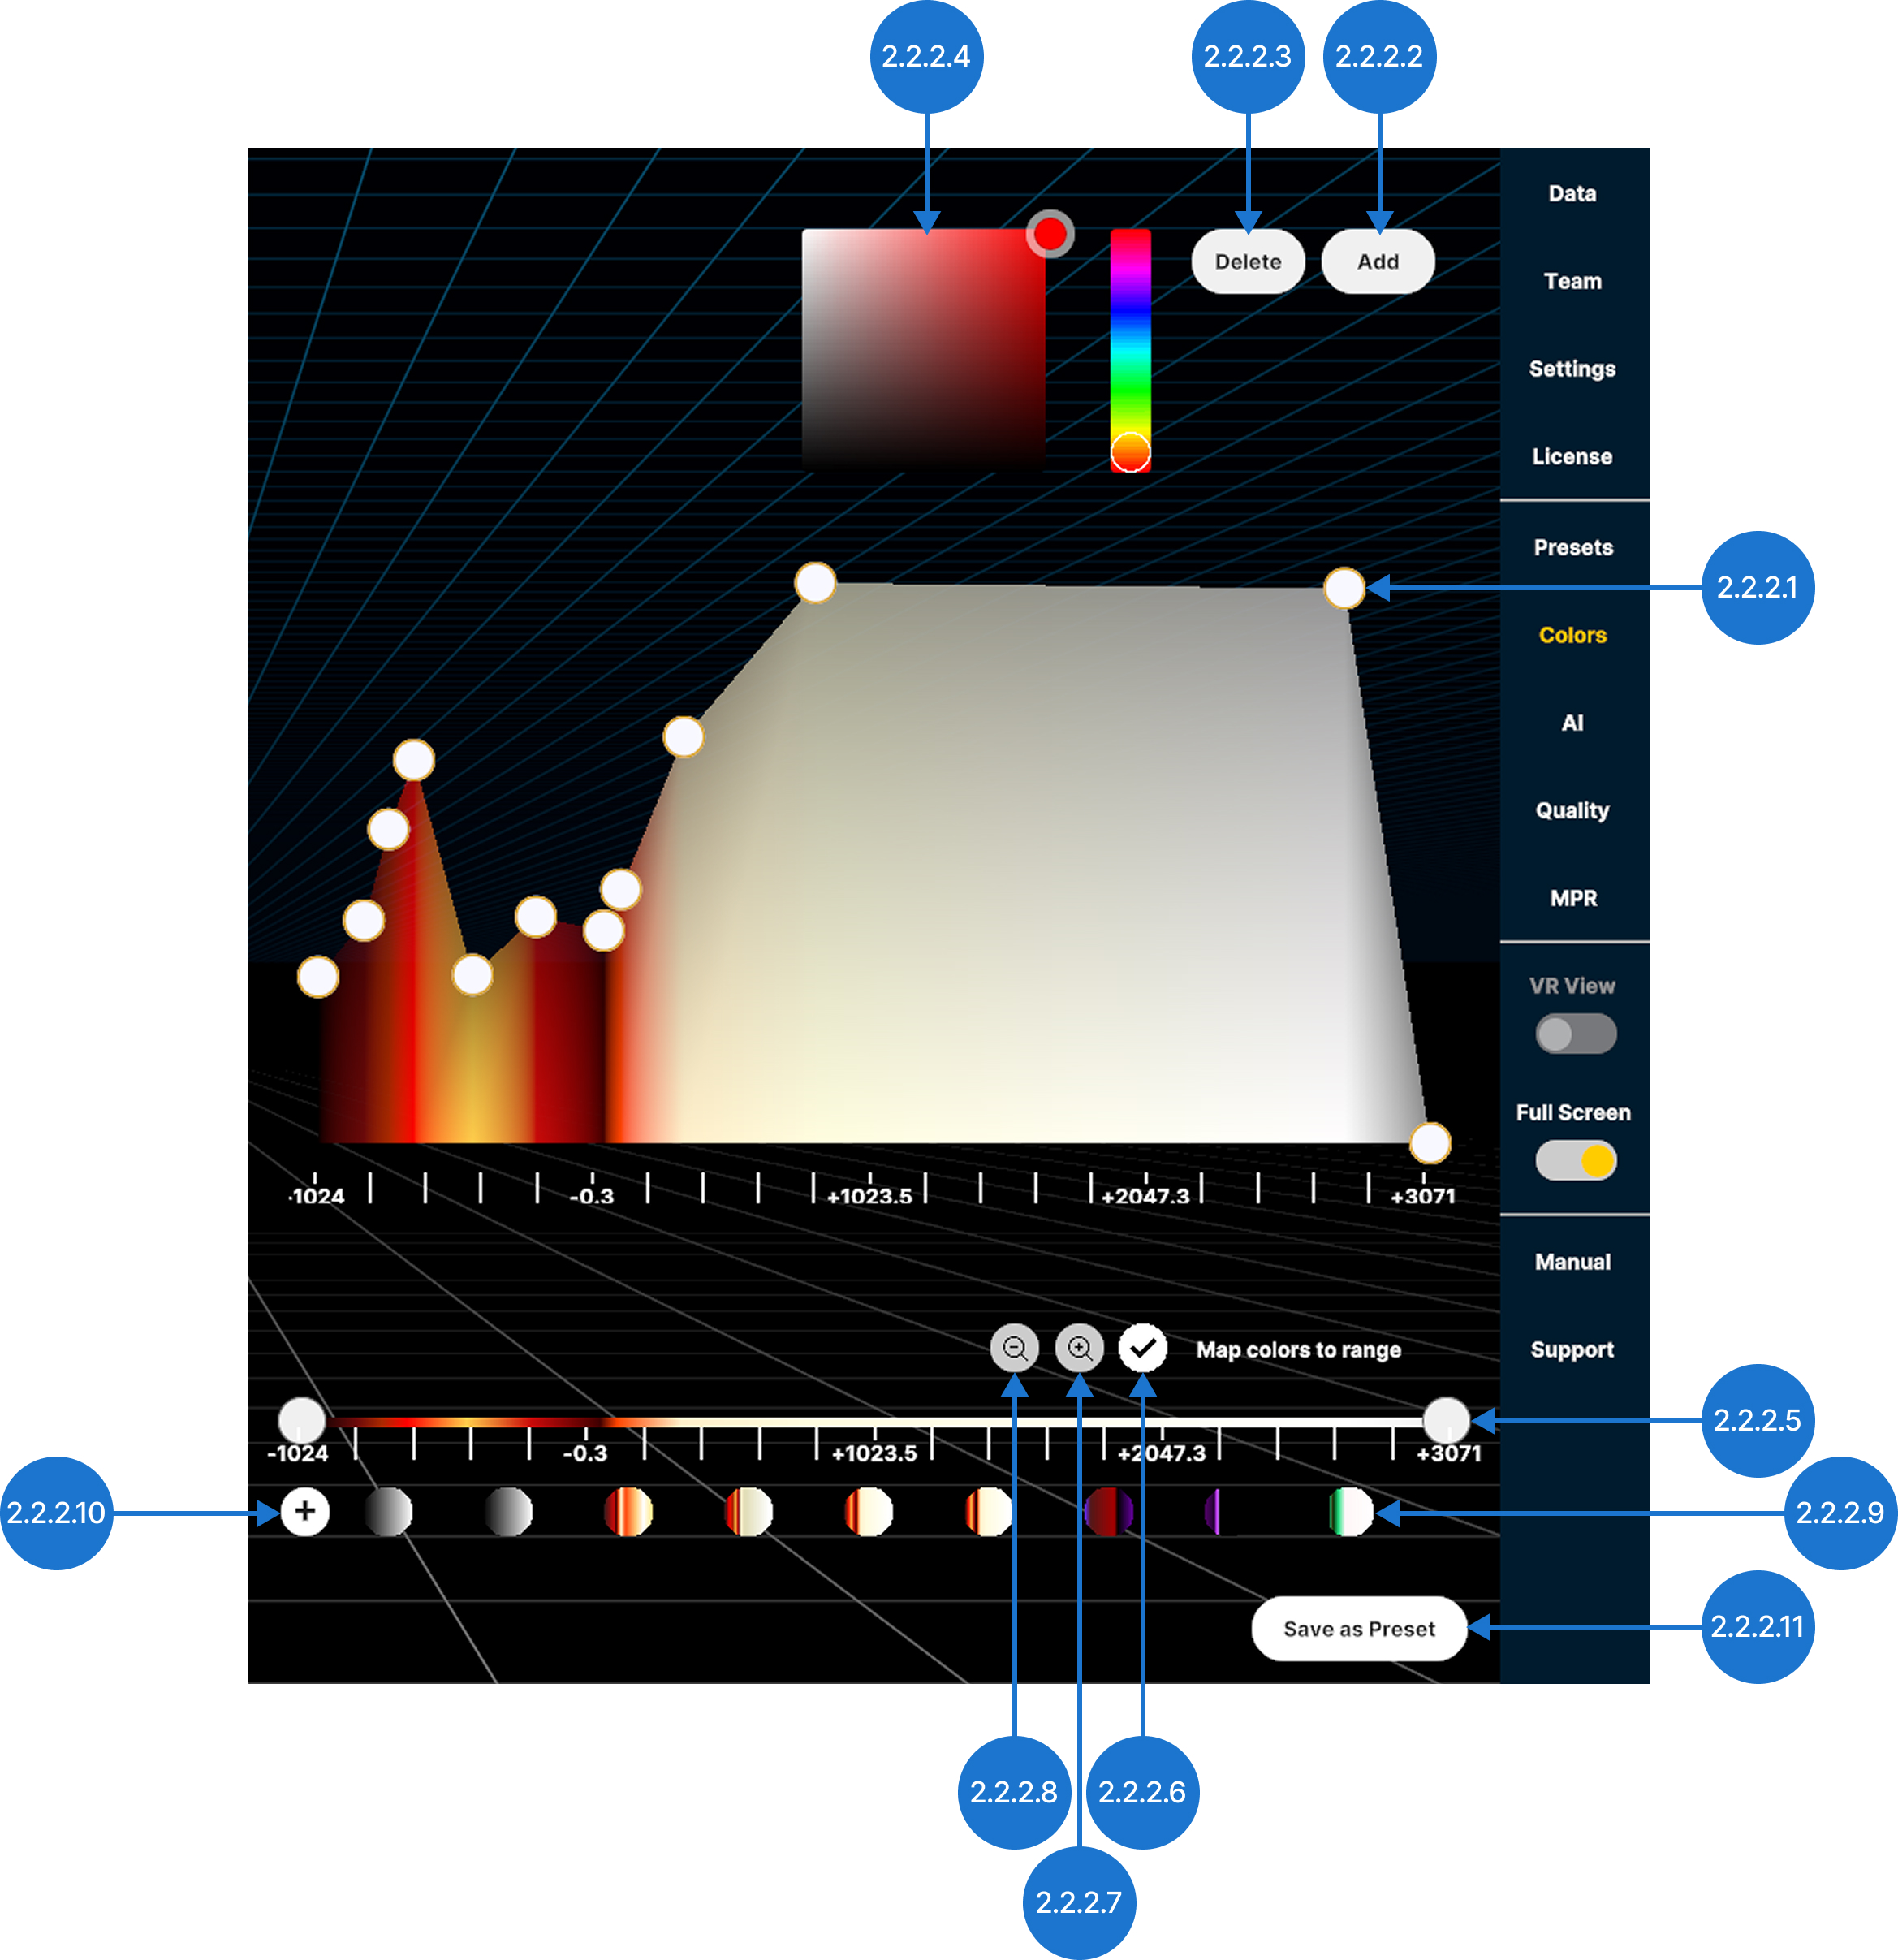
A preset is a saved configuration of display and processing settings. Scroll through the preset list to browse your saved presets.
2.2.1.1
Add Preset
Saves the current transfer function, tissue filter, and segmentation settings as a new preset.
2.2.1.2
Preset
Loads a saved preset.
2.2.1.3
Export
Saves the preset to your output directory in a .mh format.
2.2.1.4
Delete
Deletes the preset.
2.2.2
Colors
2.2.2.V1.9-01
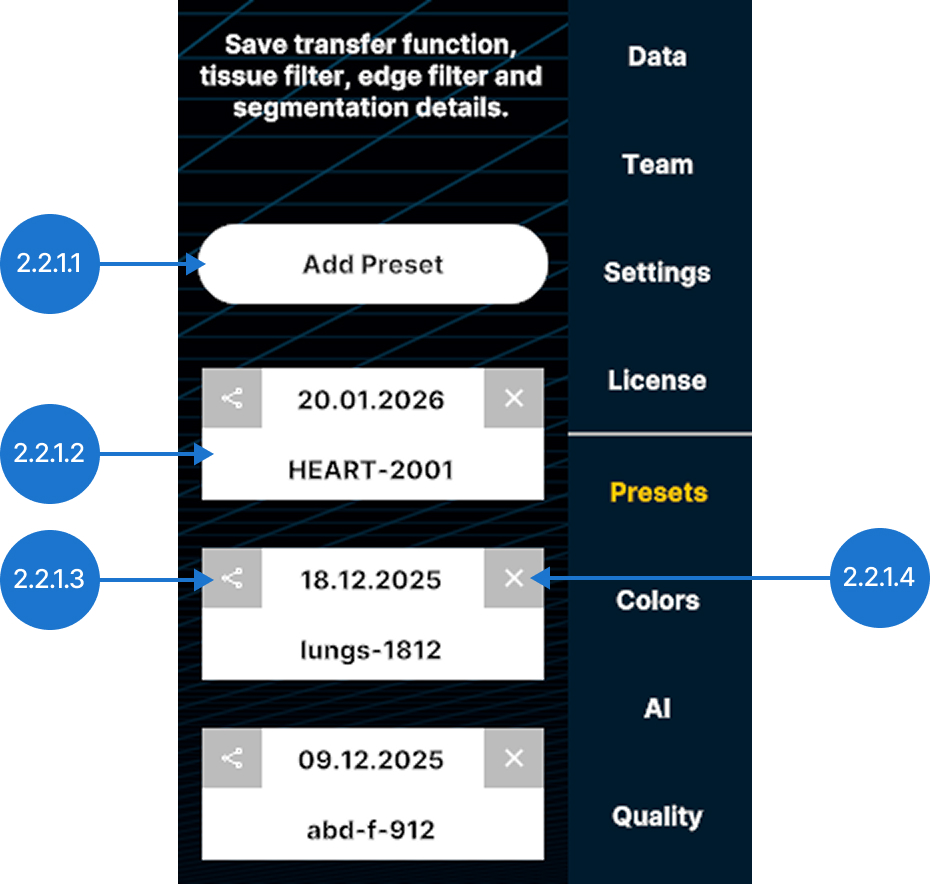
Assign colors and transparency to specific HU values or ranges to improve the visualization of your DICOM data.
2.2.2.1
Color picker
Changes the color of a pin.
2.2.2.2
Delete
Removes the selected pin from the graph.
2.2.2.3
Add
Creates a new pin at the midpoint of the selected color range. You can also select an empty area of the graph to add a pin at that location.
2.2.2.4
Color pins
Adjust transparency and assign colors to specific Hounsfield Units (HU) values.
Drag a selected pin vertically to change transparency (0–100%, logarithmic scale).
Drag a selected pin horizontally to assign a color to an HU value.
2.2.2.5
Tissue filter
Adjusts the visible range of the DICOM data using Hounsfield unit (HU) values. Move the minimum and maximum handles individually, or drag the entire range along the axis.
2.2.2.6
Save transfer function
Saves the current transfer function as a new preset.
2.2.2.7
Transfer function presets
Browse the saved transfer functions and select a preset to apply it.
2.2.2.8
Zoom out
Restores the HU axis to the default range.
2.2.2.9
Zoom in
Scales the HU axis to display only the selected range.
2.2.2.10
Map colors to range
Switches between fixed and automatically adjusted color modes. When Map colors to range is disabled, colors remain assigned to specific HU values. As a result, narrowing the HU range may hide some colors. When Map colors to range is disabled, colors remain assigned to specific HU values. As a result, narrowing the HU range may hide some colors.
2.2.2.11
Save as an option preset
Saves the main transfer function, tissue filter, and segmentation settings as a new preset.
2.2.3
AI
2.2.3.V1.9-01
Provides automatic segmentation of CT and MRI scans, quickly identifying and separating anatomical structures such as organs, bones, and tissues. For details, see section 3 of the manual.
2.2.4
Quality
2.2.4.V1.9-01
These settings balance performance and visual quality.
2.2.4.1
Quality slider
Sets the rendering quality for the currently selected dataset.
Note: quality settings above 50% offer only minor visual improvements but require significantly more processing power.
2.2.4.2
Shadows
Toggles the visibility of shadows created by the light sources.
2.2.4.3
Add light
Adds another light source, represented by a yellow sun icon, and displays its control panel. Use the slider to adjust the light intensity. You can add up to four additional light sources to each model.

2.2.5
Multiplanar reconstruction (MPR)
2.2.5.V1.9-01
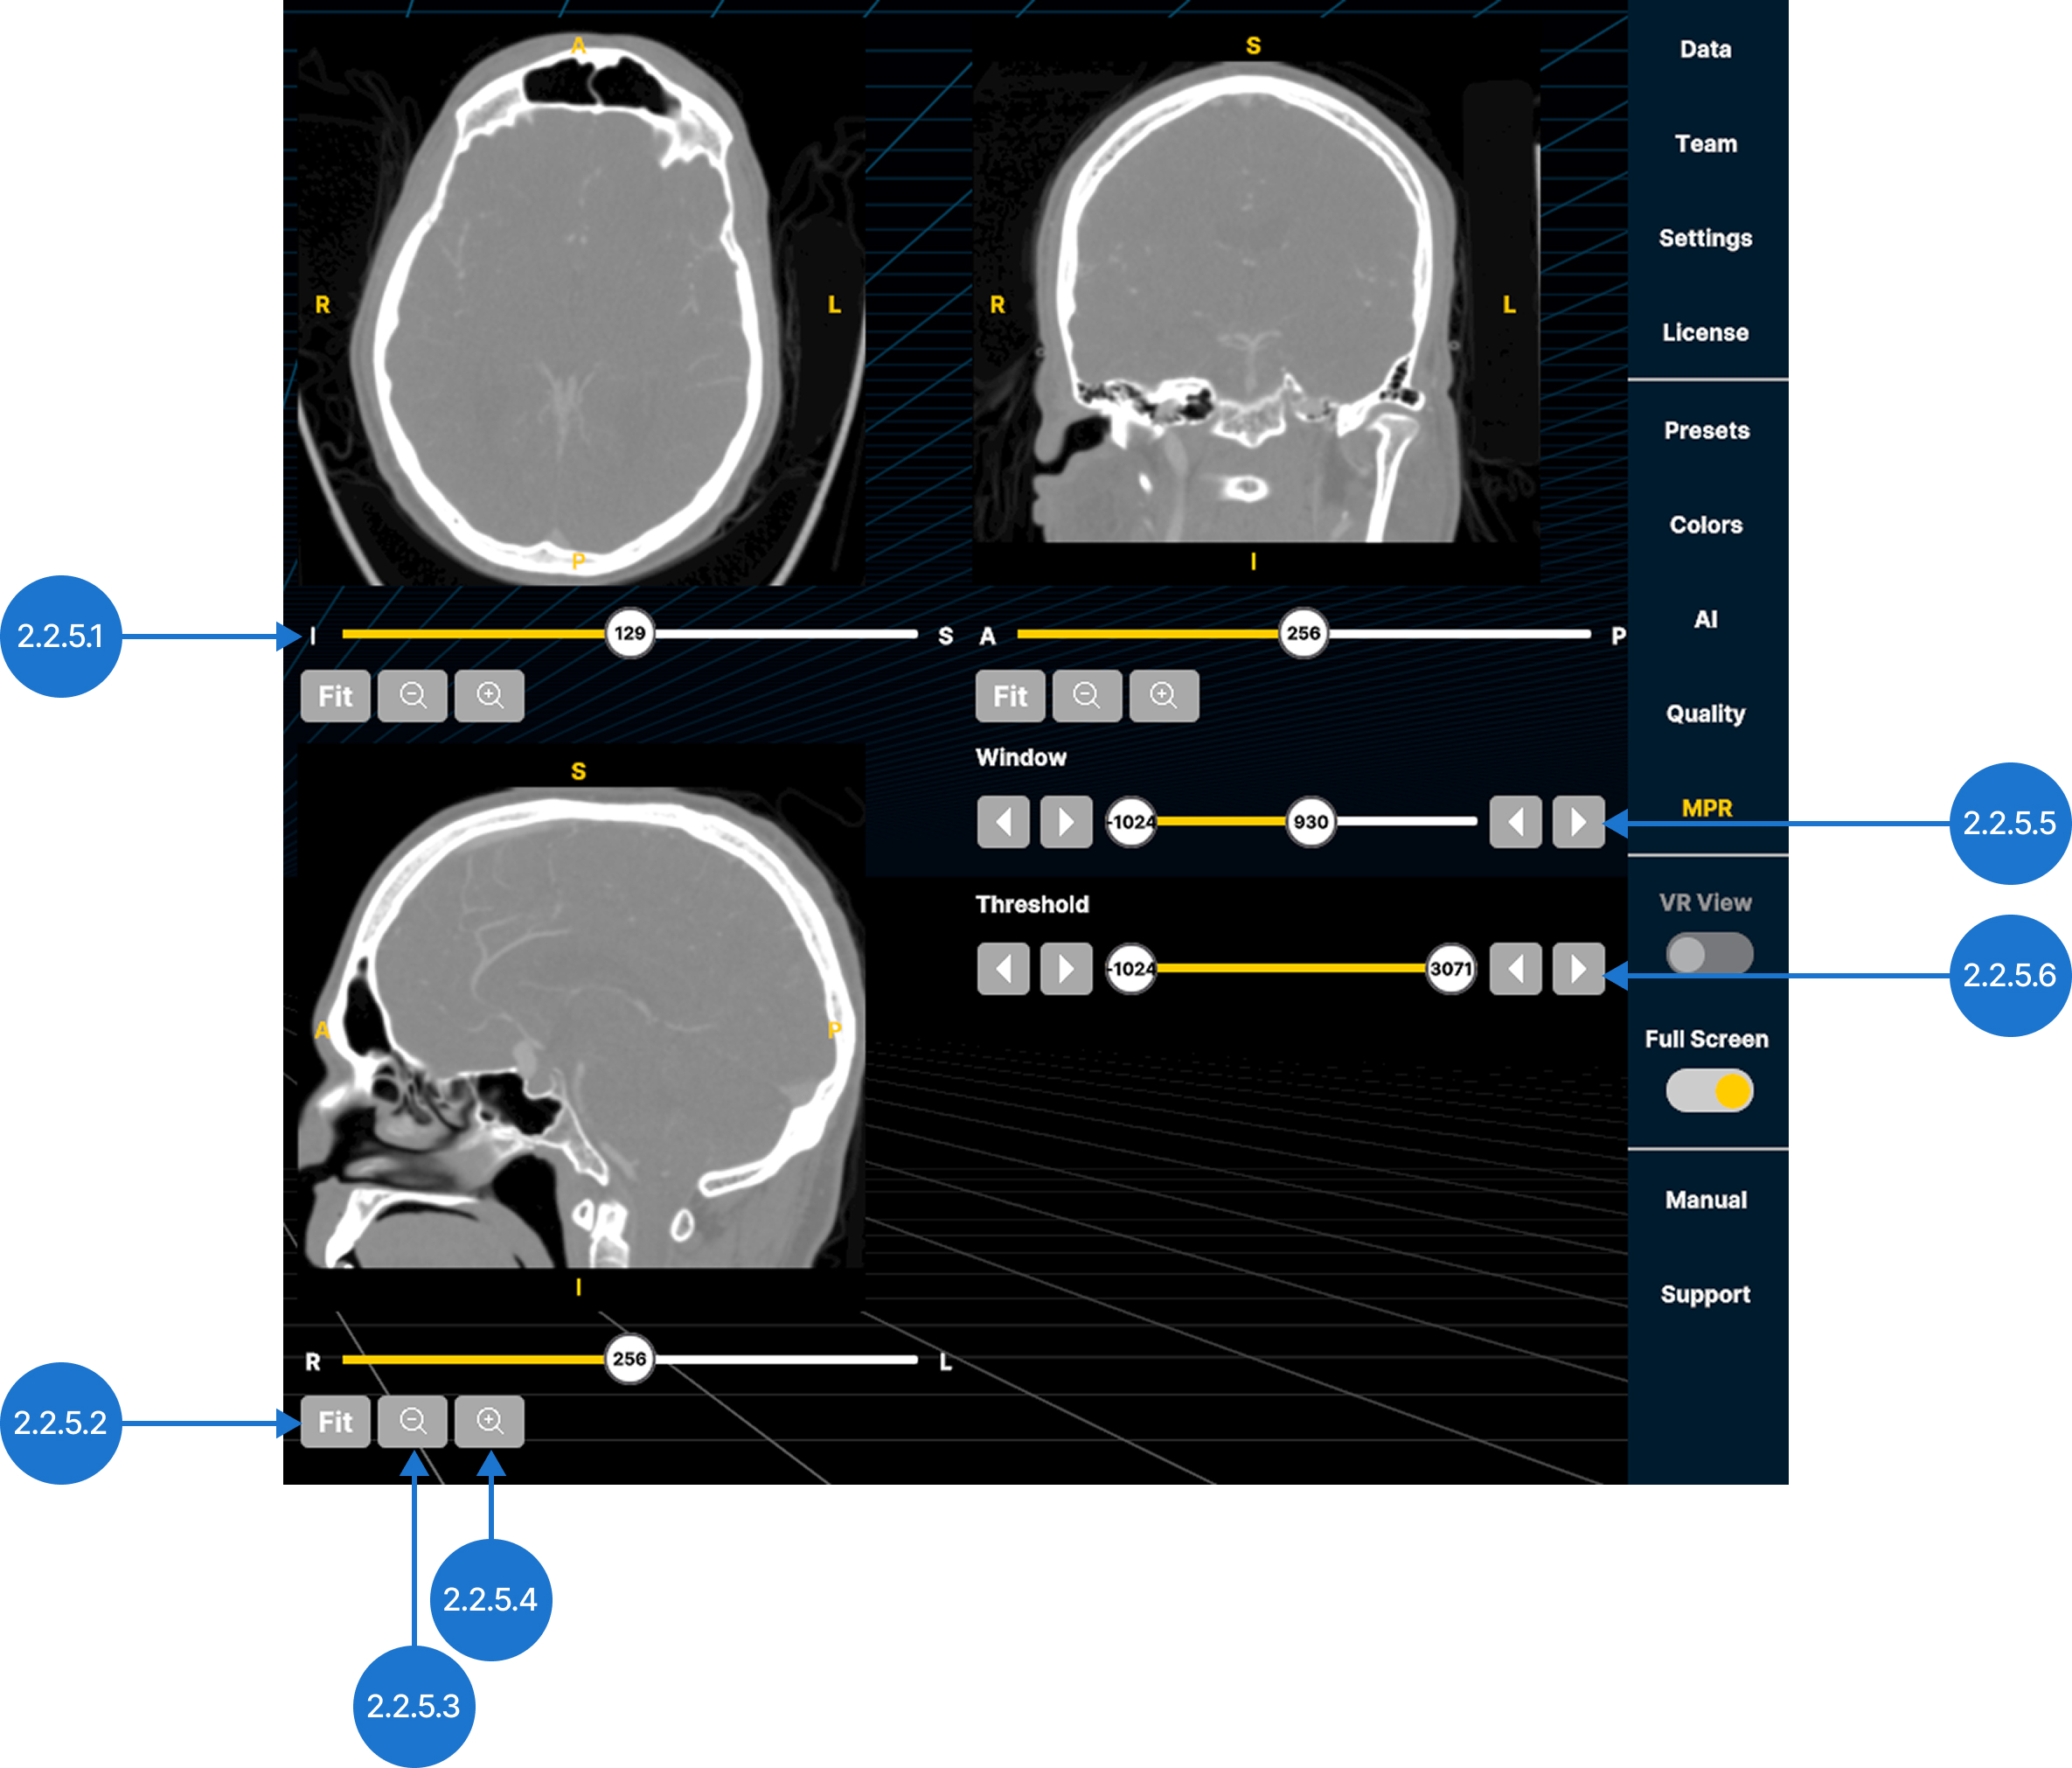
View DICOM data in the three standard anatomical planes: axial (inferior to superior), coronal (anterior to posterior), and sagittal (left to right).
2.2.5.1
Slice slider
Lets you move through the image slices along the selected anatomical axis.
2.2.5.2
Fit
Resets the zoom level to fit the image in the view.
2.2.5.3
Zoom out
Zooms out the view.
2.2.5.4
Zoom in
Zooms in the view.
2.2.5.5
Window
Adjusts the range of grayscale values displayed. Select and move the slider left or right, then release. Use the arrows to decrease/increase the value.
2.2.5.6
Threshold
Sets the displayed Hounsfield Unit (HU) range. Select and move the slider left or right, then release. Use the arrows to decrease/increase the value.